forum@abinit.org
Subject: The ABINIT Users Mailing List ( CLOSED )
List archive
- From: matthieu verstraete <matthieu.jean.verstraete@gmail.com>
- To: forum@abinit.org
- Subject: Re: [abinit-forum] plotting the realspace wavefunction
- Date: Thu, 6 Aug 2009 13:34:34 +0200
- Domainkey-signature: a=rsa-sha1; c=nofws; d=gmail.com; s=gamma; h=mime-version:in-reply-to:references:date:message-id:subject:from:to :content-type; b=u1ZFMqZ3rmdR0ciNtnKZXJ0r+OV4mmkfOduDn/dtxC8lTp/q+gNsndmTwtfqeoPCc/ A9zgJHn02S7JYaIUWghbUw0X+UeMFslJnPEzoPggyeZXHngYWB6c/9l553xqYKXnNwMF kO2FMvfS93V2lN6Np8FCdQb7cOT8k/qxiJ2Sg=
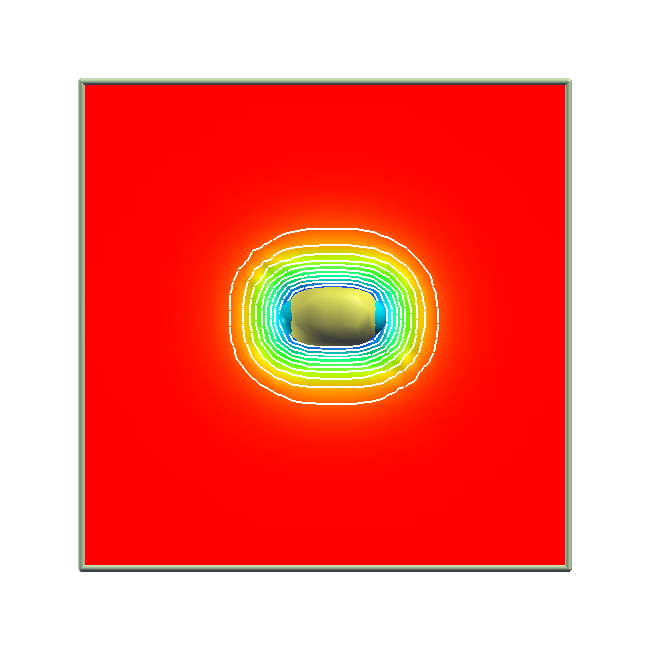
Your result is perfectly normal. As Adam said you are in a periodic
setting, and the atoms are on the edge, so the sigma bonding orbital
is spread across several cells. As I mentioned before, you can shift
the origin in cut3d (xcrysden option) to put the atoms in the middle
of the cell. Result attached with isosurface and color plane with
isolines in xcrysden.
Matthieu
On Wed, Aug 5, 2009 at 7:56 PM, Adam Sorini<asorini@gmail.com> wrote:
> Hi Markus,
>
> The system in necessarily periodic in abinit, so in the figure the H2
> molecule is shown as split up (the H atom with the negative basis coordinate
> is shifted by a lattice vector to put it in the conventional unit cell) and
> repeated a few times. If you choose to view a few more unit cells (an option
> in xcrysden), you will see the H2 molecule and how it is repeated.
>
> I'm not totally sure about this, but from what other people have said, it
> seems that what cut3d has given you is the magnitude of the wavefunction for
> the orbital you chose. This is a function of three dimensional space which I
> will call f(x,y,z). You have plotted a single isosurface. I.e., you choose a
> value between 0 and 134 which I will call 'V' and you are plotting the 2-d
> surface defined by
>
> f(x,y,z)=V
>
> So, you have the (magnitude of the (?)) wavefunction in 3d space, but how
> are you supposed to visualize it? Well, if you wanted to make a plot of
> f(x,y,z) you would need FOUR axes... which you can't do. So, to have a
> tractable plot xcrysden plots isosurfaces (which can be done in 3d rather
> than 4d)... If you want to show this to someone and have them understand
> something about the wavefunction you could just plot a selection of a few
> isosurfaces and color them differently and then use the color to indicate
> the value of the wavefunciton (I.e., put a color scale key off to the side
> of the graph).
>
> I haven't made too many of these types of plots myself so I don't really
> know a good way to do it other than what I have just described.
>
> Maybe other people will have more input on how to make pretty pictures of
> wavefuctions? I would like to know too. Cheers,
>
> Adam
>
> On Wed, Aug 5, 2009 at 10:29 AM, Markus Wohlgenannt
> <markus-wohlgenannt@uiowa.edu> wrote:
>>
>> Hi Adam,
>>
>> I succeeded to print the isosurfaces, but they don't make any sense to me
>> (attached file. The values on the grid were between 0 and 134, and I chose
>> 20 for the isosurface). Have you ever tried to plot the wavefunction for
>> tutorial 1.1? If so, can you send me what you obtain, and how you did it.
>> If
>> not, any other tips? For my project, I finally need the real-space
>> wavefunction as a function of (x,y,z), the wavefunctions I obtain from
>> cut3d
>> just don't seem to make any sense,
>>
>> Many thanks for your help,
>>
>> Markus
>>
>> On Tue, Aug 4, 2009 at 9:24 PM, Adam Sorini <asorini@gmail.com> wrote:
>>>
>>> On Tue, Aug 4, 2009 at 2:48 PM, Markus Wohlgenannt
>>> <markus-wohlgenannt@uiowa.edu> wrote:
>>>>
>>>> Dear Matthieu,
>>>>
>>>> Thank you for your answers, please see my responses below
>>>> On Tue, Aug 4, 2009 at 1:50 PM, matthieu verstraete
>>>> <matthieu.jean.verstraete@gmail.com> wrote:
>>>>>
>>>>> Hello Markus,
>>>>>
>>>>> 1) have you checked that you are only looking at the real part of the
>>>>> wf? As indicated, by default you get both real and imaginary parts,
>>>>> and abinit has no particular preference for real valued wf for finite
>>>>> systems. You should probably plot the norm squared, using both values,
>>>>> or plot both values side by side.
>>>>
>>>>
>>>> Yes, I have checked that, the imaginary part numbers are all zero (or
>>>> 1E-16).
>>>>>
>>>>> 2) are you sure you have the correct band? This looks like a high
>>>>> lying box state with all the weight at the edges
>>>>
>>>>
>>>> Yes, I am using the tutorial example 1.1 unchanged, in this example we
>>>> calculate 2 bands, and I am plotting band 1 of two.
>>>>>
>>>>> 3) the plot looks like it is not centered properly: are you certain
>>>>> about the position of the molecule (around 0,0,0 I presume) and the
>>>>> coordinates of the box you plot? If the molecule is actually in a
>>>>> corner of the box this makes more sense, and suggests the box is not
>>>>> big enough as the density in the middle is not very small...
>>>>
>>>>
>>>> Yes, I centered it around 0 0 0. Also I am pretty sure it is not merely
>>>> a problem of centering, because I also calculated other molecules which
>>>> have
>>>> non-spherical, very characteristic shapes, and the wavefunction I plot
>>>> never
>>>> has any resemblence to the density plot (the latter is always as
>>>> expected).
>>>> Regarding the box-size, I am using tutorial example 1.1 unchanged, so the
>>>> box may be a little small according to the convergence studies done in
>>>> later
>>>> tutorials, but it shouldn't be too much off.
>>>>>
>>>>> 4) try the xcrysden format. That gives you the norm squared
>>>>> automatically, and you can visualize it more easily, without messing
>>>>> around with scripts etc... (option 9 in the main cut3d menu for wf).
>>>>> In this case, if your molecule is not centered, you can shift the data
>>>>> by a certain number of grid points to center it.
>>>>
>>>>
>>>> I have two options (option 9 in my cut3d is 3D Data Explorer, only
>>>> imaginary part). I have option 11 "Xcrysden formatted data and position
>>>> files" and option 13 "XCrysden/Venus wavefunction real data". When I
>>>> choose
>>>> option 11 I obtain a file which, when I open it, seems to contain the
>>>> norm^2
>>>> (since all numbers are positive), but there are no indexed coordinates.
>>>> When
>>>> I open it in XCrysDen, I only obtain 4 dots (which presumably signify
>>>> some
>>>> lattice, but no plot of the data itself.
>>>
>>> You can see isosurfaces of the data if you click on "Tools" in the upper
>>> right. Then click on "data grid". Then click "ok". Then choose an
>>> iso-value
>>> in the window that pops up. Then click "submit".
>>>
>>>>
>>>> When I chose option 13, cut3d terminates with an error "At line 1454 of
>>>> file wffile.F90 (unit=12,file='myfilename') Fortran runtime error: Cannot
>>>> change STATUS parameter in OPEN statement".
>>>>
>>>> I would appreciate further help from you,
>>>>
>>>> Many thanks,
>>>>
>>>> Markus
>>>>>
>>>>> Cheers
>>>>>
>>>>> Matthieu
>>>>>
>>>>>
>>>>> On Tue, Aug 4, 2009 at 7:56 PM, Markus
>>>>> Wohlgenannt<markus-wohlgenannt@uiowa.edu> wrote:
>>>>> > Dear forum,
>>>>> >
>>>>> > I am a new user to abinit and have a question. I hope someone can
>>>>> > help me.
>>>>> >
>>>>> > I want to plot the real space wavefunction. I was trying to use
>>>>> > cut3d. Cut3d
>>>>> > works well for plotting the density. I attached the plot of the
>>>>> > density in
>>>>> > the molecular plane for tutorial one, H2. But when I try to plot the
>>>>> > real-space wavefunction, I seem to get nonsensical results, the
>>>>> > corresponding wavefunction plot is shown as the second graph in my
>>>>> > attachement. I did the following to obtain this plot. I start cut3d,
>>>>> > and
>>>>> > tell it to open the WFK file. Then I choose option "0" to analyze the
>>>>> > wavefunction, choose band 1, I do not want atomic analysis (option
>>>>> > 0), then
>>>>> > I choose option 4 "3D indexed real and imaginary data".
>>>>> >
>>>>> > Then I manually select the molecular plane by deleting all data
>>>>> > outside the
>>>>> > plane I want to view, i.e. all data for which z neq Z, where I choose
>>>>> > Z
>>>>> > half-way between the minum and maximum z to obtain the molecular
>>>>> > plane.
>>>>> >
>>>>> > What am I doing wrong? Or else, is there an easier way to plot the
>>>>> > real-space wavefunction?
>>>>> >
>>>>> > Someone please help,
>>>>> >
>>>>> > Thanks,
>>>>> >
>>>>> > Markus
>>>>> >
>>>>> > --
>>>>> > Markus Wohlgenannt
>>>>> > Associate Professor
>>>>> > Department of Physics and Astronomy
>>>>> > University of Iowa
>>>>> > markus-wohlgenannt@uiowa.edu
>>>>> > 319-353-1974
>>>>> >
>>>>> >
>>>>>
>>>>>
>>>>>
>>>>> --
>>>>> ~~~~~~~~~~~~~~~~~~~~~~~~~~~~~~~~~~~~~~~~~~~~~~~~~~~~~~~~~~~~~~~~~~
>>>>> Dr. Matthieu Verstraete
>>>>>
>>>>> European Theoretical Spectroscopy Facility (ETSF)
>>>>> Dpto. Fisica de Materiales,
>>>>> U. del Pais Vasco,
>>>>> Centro Joxe Mari Korta, Av. de Tolosa, 72, Phone: +34-943018393
>>>>> E-20018 Donostia-San Sebastian, Spain Fax : +34-943018390
>>>>>
>>>>> Mail : matthieu.jean.verstraete@gmail.com
>>>>> http://www-users.york.ac.uk/~mjv500
>>>>>
>>>>
>>>>
>>>>
>>>> --
>>>> Markus Wohlgenannt
>>>> Associate Professor
>>>> Department of Physics and Astronomy
>>>> University of Iowa
>>>> markus-wohlgenannt@uiowa.edu
>>>> 319-353-1974
>>>>
>>>
>>
>>
>>
>> --
>> Markus Wohlgenannt
>> Associate Professor
>> Department of Physics and Astronomy
>> University of Iowa
>> markus-wohlgenannt@uiowa.edu
>> 319-353-1974
>>
>
>
--
~~~~~~~~~~~~~~~~~~~~~~~~~~~~~~~~~~~~~~~~~~~~~~~~~~~~~~~~~~~~~~~~~~
Dr. Matthieu Verstraete
European Theoretical Spectroscopy Facility (ETSF)
Dpto. Fisica de Materiales,
U. del Pais Vasco,
Centro Joxe Mari Korta, Av. de Tolosa, 72, Phone: +34-943018393
E-20018 Donostia-San Sebastian, Spain Fax : +34-943018390
Mail : matthieu.jean.verstraete@gmail.com
http://www-users.york.ac.uk/~mjv500
Attachment:
t11_wf_k1_b1_s1.png
Description: PNG image
- [abinit-forum] plotting the realspace wavefunction, Markus Wohlgenannt, 08/04/2009
- Re: [abinit-forum] plotting the realspace wavefunction, matthieu verstraete, 08/04/2009
- Re: [abinit-forum] plotting the realspace wavefunction, Markus Wohlgenannt, 08/04/2009
- Re: [abinit-forum] plotting the realspace wavefunction, Adam Sorini, 08/05/2009
- Re: [abinit-forum] plotting the realspace wavefunction, Markus Wohlgenannt, 08/05/2009
- Re: [abinit-forum] plotting the realspace wavefunction, Adam Sorini, 08/05/2009
- Re: [abinit-forum] plotting the realspace wavefunction, matthieu verstraete, 08/06/2009
- Re: [abinit-forum] plotting the realspace wavefunction, Adam Sorini, 08/05/2009
- Re: [abinit-forum] plotting the realspace wavefunction, Markus Wohlgenannt, 08/05/2009
- Re: [abinit-forum] plotting the realspace wavefunction, Adam Sorini, 08/05/2009
- Re: [abinit-forum] plotting the realspace wavefunction, Markus Wohlgenannt, 08/04/2009
- Re: [abinit-forum] plotting the realspace wavefunction, matthieu verstraete, 08/04/2009
Archive powered by MHonArc 2.6.16.